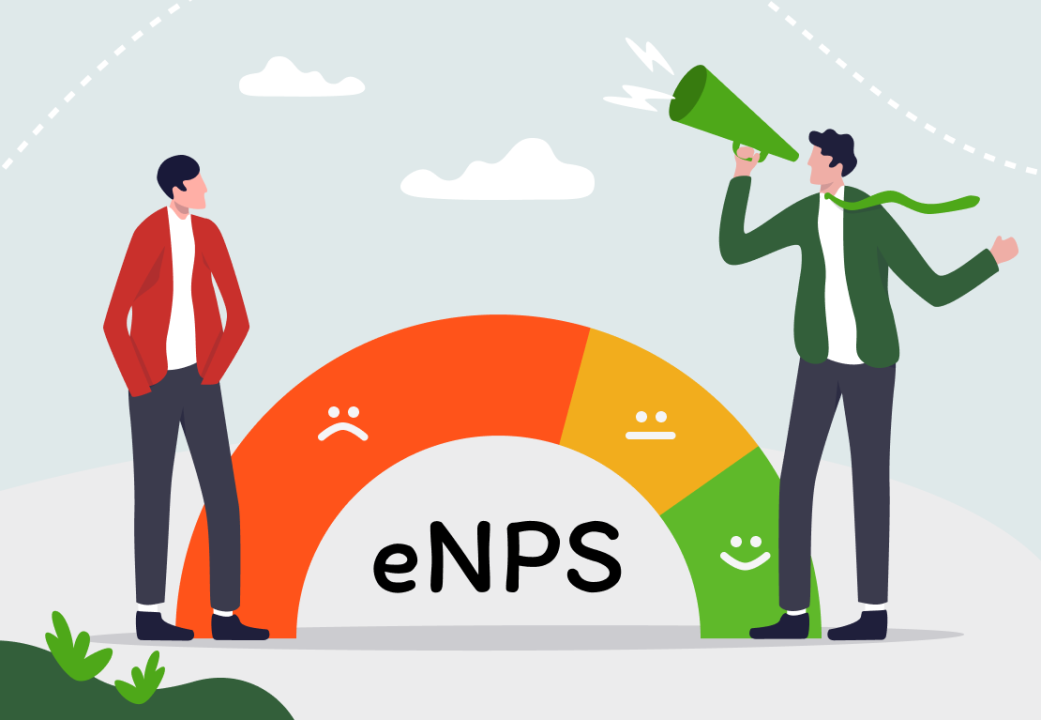
eNPS is the workplace version of that question every company asks its customers. Not "would you recommend our product" this time, but "would you recommend working here."
It's one question, it takes about 4 seconds to answer, and it produces a single number between -100 and +100. That simplicity is why every HR platform on earth offers it, including ours. It's also why it gets misread more than any other metric in the category.
What eNPS is, how it's worked out, what a good one looks like, and the three things it genuinely can't tell you.
eNPS, or employee Net Promoter Score, measures how likely your people are to recommend your organisation as a place to work. Everyone answers one question on a scale of 0 to 10. Scores of 9 and 10 are promoters, 7 and 8 are passives, and 0 to 6 are detractors. Your eNPS is the percentage of promoters minus the percentage of detractors, which lands somewhere between -100 and +100.
How eNPS is calculated
Say 100 people answer. 45 give you a 9 or 10, 35 give you a 7 or 8, and 20 give you a 6 or below. 45% promoters minus 20% detractors gives you an eNPS of 25.
Two things about that calculation catch people out, and both are worth understanding before you put the number in a board pack.
It isn't a percentage. An eNPS of 25 doesn't mean 25% of anything. It's the gap between two groups, expressed as a number on a scale that runs from -100 to +100. Writing "our eNPS is 25%" is the fastest way to tell a room that you don't know how it works.
Your passives count for nothing. Those 35 people who gave you a 7 or an 8? They contribute precisely zero. Someone who is broadly happy, gets on with their job and has no plans to leave counts exactly the same as if they hadn't answered. That's a deliberate design choice borrowed from customer NPS, and it means eNPS is much more sensitive to your unhappy people than to your content ones. Useful to know when the number moves and you're trying to work out why.
What's a good eNPS score?
Here's where we’d push back on most articles about this, including the earlier version of this one. The commonly used bands look roughly like this. Below 0 means more detractors than promoters and something is properly wrong. 0 to 10 is a balance of both with work to do. 10 to 30 is healthy. 30 to 50 is strong. Above 50 is genuinely exceptional and rarer than the internet suggests.
Now the part that matters more than the bands: the published benchmarks disagree with each other enormously.
Perceptyx, whose benchmark database covers more than 20 million employees, puts the global average at around 14. QuestionPro's study of 5,000 full-time employees puts the average across industries at 32. Those are both credible sources and they're 18 points apart, which is the difference between "you're below average, panic" and "you're above average, relax."
The gap comes from sample composition. One dataset skews towards companies who are already actively measuring employee experience, and companies who measure tend to score better. So depending on whose chart you find first, the same score makes you a laggard or a leader.
Industry moves it too, and so does company size, because smaller organisations consistently score higher, largely because people actually know each other. And so does country, because some cultures simply don't hand out 9s and 10s.
So what should you do with benchmarks? Use them for orientation, not judgement. The only comparison that reliably means anything is your score against your own score last quarter. A move from 18 to 26 in your own organisation tells you something real. Being 4 points below a benchmark drawn from a different industry in a different country tells you almost nothing.
The thing eNPS can't tell you
This is the bit we care most about, because it's where a lot of businesses waste a year.
A score is not a reason.
If your eNPS comes back at 12, you now know that a chunk of your people wouldn't recommend working for you. You do not know whether that's the shift patterns, the pay review that got delayed, one particular manager, the fact that the car park is full by half eight, or something nobody has said out loud yet.
You've got a number that tells you there's a problem, at exactly the level of detail that makes it impossible to act on. So what usually happens next is that someone commissions a big engagement survey to find out why, which takes six weeks to write and another six to analyse, by which point the people who were most annoyed have already gone.
eNPS works best as a headline sitting on top of something that explains it. On its own, it's a smoke alarm with no indication of which room.
Why eNPS goes haywire in small teams
Worth knowing before you start comparing team scores in a management meeting. Because eNPS is built on percentages, small groups swing violently. Take a team of 12. One person moves from a 9 to a 6, maybe because of a bad fortnight rather than anything structural. That single change drops the team's eNPS by about 17 points.
Seventeen points…from one person, on a scale where the difference between "healthy" and "something's wrong" is about twenty.
Below a certain group size you're not reading a trend, you're reading one person's Tuesday. It's also an anonymity issue, because in a team of 5 a single detractor is often identifiable to a manager who knows their people. We don't show any view covering fewer than 5 people, and eNPS is exactly the metric that rule exists for.
How often should you ask?
Not weekly. This is one of the few things we deliberately don't ask every week.
"Would you recommend working here" is a considered, whole-experience question. It doesn't meaningfully change between a Tuesday and the following Tuesday, and asking it that often trains people to answer on autopilot, which quietly ruins the data.
We run eNPS quarterly. That's frequent enough to see a genuine trend across a year, and spaced enough that people give it a moment's thought. Between those, the weekly questions do the work of explaining the movement, so when eNPS drops 9 points in Q3 you can already see that reward and recognition has been sliding since June.
Quarterly for the headline, weekly for the reasons. That combination is the whole argument, really.
Questions people ask us about eNPS
What is eNPS? eNPS, or employee Net Promoter Score, measures how likely employees are to recommend their organisation as a place to work. It uses one question on a 0 to 10 scale, and produces a single score between -100 and +100.
How is eNPS calculated? Subtract the percentage of detractors (people scoring 0 to 6) from the percentage of promoters (9 to 10). Passives, who score 7 or 8, are excluded from the calculation entirely.
What is a good eNPS score? Anything above 0 means more promoters than detractors. 10 to 30 is commonly considered healthy, 30 to 50 strong, and above 50 exceptional. Published averages vary widely, from around 14 in Perceptyx's global database to 32 in QuestionPro's study, so treat any single benchmark with caution.
Is eNPS the same as an engagement score? No. eNPS is one question about advocacy. An engagement score is usually built from many questions across several themes, so it can tell you which parts of the experience are driving the result. eNPS tells you the temperature, not the cause.
How often should you measure eNPS? Quarterly works well for most organisations. It gives you four data points a year without asking a big-picture question so often that people stop thinking about it.
Can eNPS be anonymous? Yes, and it should be. Because eNPS is so sensitive in small groups, apply a minimum group size to reporting so no score is ever shown for a team small enough that individuals could be identified.
What are the limitations of eNPS? It's a single number with no explanation attached, it ignores your passives entirely, it swings sharply in small teams, and benchmarks across organisations are unreliable. It's a good headline and a poor diagnosis.
The short version
eNPS is worth tracking. It's quick, people actually answer it, and a score moving 10 points in a quarter is a real signal that something has changed.
Just don't ask it to do a job it can't do. It tells you how your people feel about you overall. It won't tell you why, it won't tell you what to fix first, and compared against someone else's benchmark it barely tells you anything at all.
Track your own trend, ask enough other questions to explain the movement, and act on what you find.